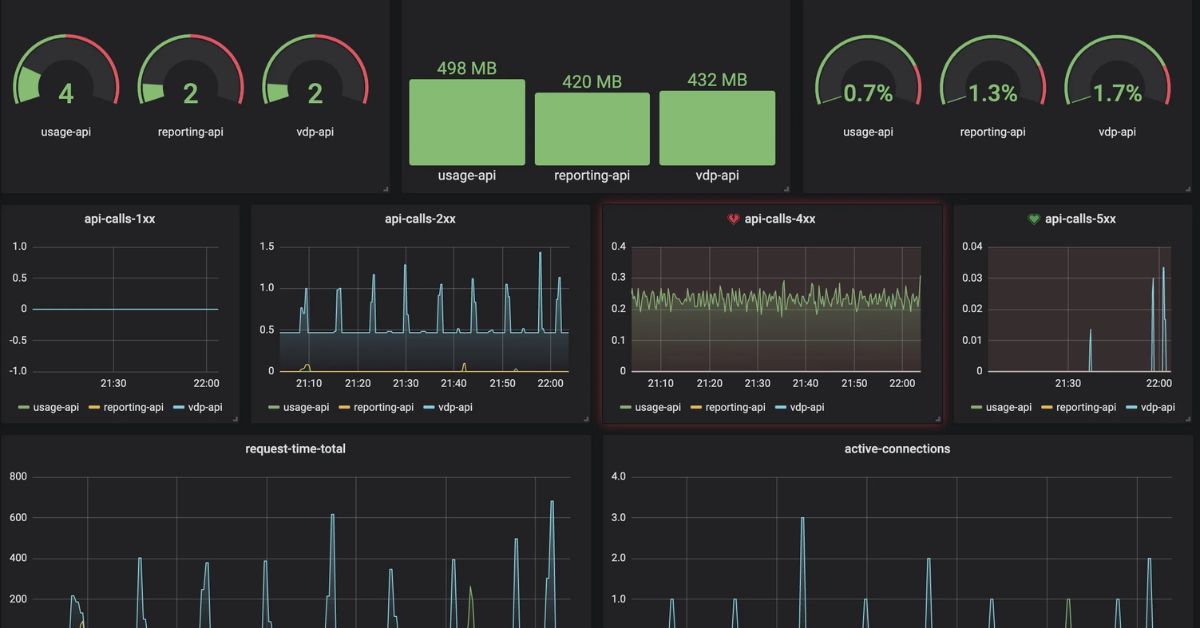
Introduction:
In realm operating systems Linux stands out for its robustness flexibility and open source nature. One of key elements that ensure smooth functioning of Linux systems is effective monitoring and diagnostics. In guide we delve into arsenal of powerful tools available in Linux ecosystem system monitoring and diagnostics. From command line utilities to sophisticated graphical interfaces Linux offers a plethora of options to keep your system running at its peak performance.
- Exploring Enhanced Touch Experience in Windows 11
- Advancements in Voice Typing: User Experience Through Enhanced Functionality
Understanding System Monitoring:
Before delving into the tools themselves its crucial to grasp importance of system monitoring in Linux. Monitoring involves keeping a close eye on various aspects of system performance such as CPU usage memory consumption disk I/O network activity and more. By monitoring these parameters administrators can identify bottlenecks anticipate potential issues and optimize resource utilization.
Command-Line Tools:
- top: Among the most basic yet powerful tools
topprovides a dynamic real time view of system processes CPU usage memory usage and other vital statistics. It allows users to interactively monitor system performance and manage processes. - htop: An enhanced version of
top,htopoffers a more user friendly interface with features like color coded display scrolling task list and tree view of processes. It provides a detailed overview of system resource utilization and allows for easy process management. - vmstat: Short for “virtual memory statistics”,
vmstatprovides insights into various system parameters including CPU usage memory utilization paging and disk activity. Its particularly useful for diagnosing performance issues related to memory and I/O operations. - sar: The System Activity Reporter (
sar) collects reports and saves system activity information over time. It offers a comprehensive view of system performance metrics such as CPU memory disk and network utilization. Administrators can analyze historical data to identify patterns and trends.
Graphical Tools:
- GNOME System Monitor: As part of the GNOME desktop environment, the GNOME System Monitor provides a graphical interface for monitoring system resources. It offers a visually intuitive representation of CPU, memory, disk, and network usage, along with detailed information about running processes.
- KSysGuard: Developed for the KDE desktop environment, KSysGuard offers similar functionality to GNOME System Monitor but with a KDE-specific design. It allows users to monitor system performance in real-time through customizable graphs and tables.
- Conky: Unlike traditional graphical monitoring tools, Conky is a lightweight system monitor for X Window System. It displays customizable system information on the desktop, including CPU usage, memory utilization, disk activity, and more. Conky’s flexibility allows users to create personalized monitoring setups tailored to their specific needs.
Network Monitoring:
- iftop: For monitoring network bandwidth usage in real-time,
iftopcomes in handy. It display continuously update list of network connection and their corresponding bandwidth usage. Administrators can identify bandwidth-intensive processes and track network usage patterns. - nload: Similar to
iftop,nloadprovides a simple, easy-to-read graphical representation of network traffic on a particular interface. It offers real-time monitoring of incoming and outgoing traffic, making it useful for network troubleshooting and capacity planning.
Diagnostic Tools:
- strace: When troubleshooting software issues,
straceproves invaluable by tracing system calls and signals made by a process. It allows administrators to identify errors, understand program behavior, and diagnose performance bottlenecks. - tcpdump: For network troubleshooting and packet analysis,
tcpdumpcaptures and displays network traffic on a network interface. It provides detailed information about each packet, including source and destination addresses, protocol, and payload data. - lsof: Short for “list open files”
lsoflists all open files and processes that have them open. It’s useful for identifying which processes are accessing particular files or network sockets, helping administrators troubleshoot issues related to file access or resource contention.
Summary
In evolving landscape of Linux systems effective monitoring and diagnostics play a pivotal role in maintaining system stability and performance. By leveraging diverse array of monitoring and diagnostic tools available administrators can proactively identify issues optimize resource utilization and ensure seamless operation of Linux based environments. Whether through command line utilities or graphical interfaces Linux empowers users with tools they need to harness the full potential of their systems.


